To get an idea of how TC compares with PM, I have done a number of tests on both non-uniform sets and uniform sets, the latter consisting of either random generated sets or just monotonous grid patterns. I also ran a number of these tests with PP, but as was to be expected it wasn't possible to run the larger sets within a reasonable time, so I skipped PP for the ones with more than about 2000 particles. Note that in all tests from this chapter only 2D forces were used, to ensure that the results of TC and PP could be compared with the PM output.
Some remarks about the time measurements in this chapter : the runtime listed in all results is the so-called ``user-time'' that was spent when computing on the processor of our HP 755/125 systems. It's value was obtained using the clock() function, and as such it doesn't show the ``real-time'' or ``system-time'' spent on the program. However, the ratio is about the same for all different sorts of time and that's what we are most interested in.
But unfortunately I found that the values on HP were complete nonsense for the larger sets (taking more than about 1 hour), although on a Linux PC the same values were fine. After a long time of searching I found that the resolution on the HP is so high ( 106 ), that the available space for the clock value (4 bytes = 232 ) only allows runtimes of less than [(232)/(106)] = 4295 seconds to be measured. As this can render many hours or even days of computation to be totally useless (and in fact it did so in my case !) I decided to give this some special attention: ``forewarned is forearmed'' :-)
First let's take a look at some non-uniform sets (only runtime and energy are shown, the error in the momentum is omitted to avoid giving too much rather meaningless information). Also the results for the 3 non-uniform sets from the previous section can be found in here (see table ).
| Non-uniform | PP | TC | PM | PP | TC | PM | ||
| Particles | Steps | Time per 10000 steps | Meshsize | Energy leak (%) | ||||
| 4 | 8000 | 0.19 | 1.05 | 85.0 | 32x32 | 27.02 % | 27.02 % | -9.540 % |
| 16 | 2500 | 2.72 | 7.20 | 85.1 | 32x32 | 0.198 % | 0.199 % | 0.188 % |
| 50 | 10000 | 26.36 | 34.53 | 86.3 | 32x32 | 12.20 % | 12.26 % | -3.435 % |
| 300 (cluster) | 400 | 955.0 | 313.3 | 95.5 | 32x32 | 1.319 % | 1.319 % | 1.025 % |
| 500 | 50 | 2700.0 | 748 | 106 | 32x32 | 0.222 % | 0.222 % | 0.160 % |
| 2000 | 30 | 43880 | 3907 | 467 | 64x64 | 0.0009 % | 0.0009 % | 0.0009 % |
The run for 4 particles couldn't be completed with PM as one particle moved outside the mesh. The error in the energy is now for only 2624 iterations, so about one third of the other 2.
Note that PM always uses a meshsize of at least 32x32, which results in runtimes of about the same order for all problems except for 2000 particles, where the meshsize was increased to 64x64.
There is another important remark to be made : in all cases we can say that - as long as the number of iterations and the timestep are identical - PP must necessarily have the largest accuracy. If there are large errors in the PP results they are almost always caused by collisions and close encounters.
Well, TC is as vulnerable for close encounters as PP and so should have more or less the same error as PP, as long as the error made by the tree approximation is small compared with this error. So, the closer the error to the error made in PP, the more likely it is that the TC approximation is indeed a good one !
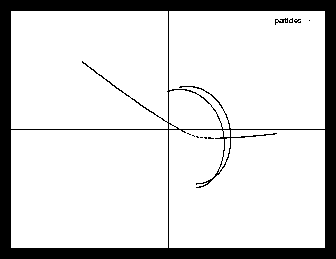
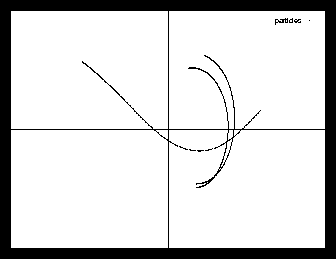
PM does not suffer from collisions and so also doesn't have the problem with energy leaks in close encounters. Energy (and also momentum) are often reasonably well preserved. However, all details caused by the close encounters are completely washed out or blurred too. I.e. the 4 body example from the introduction (with the sun, the planet and the moon: see picture ) runs fine with both TC and PP, but shows something that only vaguely resembles these pictures if run with PM (see picture 1).
Now let's take some uniform sets and do the same comparison. Table shows the results for the smaller meshes (where PP was still practically possible).
| Meshes | PP | TC | PM | PP | TC | PM | ||
| Particles | Steps | Time per 10000 steps | Meshsize | Energy leak (%) | ||||
| 16 | 10000 | 2.68 | 6.50 | 85.5 | 32x32 | 1.094 % | 1.093 % | 0.956 % |
| 64 | 2500 | 43.16 | 44.04 | 87.0 | 32x32 | 1.460 % | 1.460 % | 1.182 % |
| 256 | 1000 | 694.1 | 273.5 | 93.7 | 32x32 | 4.702 % | 4.699 % | 3.564 % |
| 500 | 100 | 2682 | 632.0 | 104.0 | 32x32 | 0.009 % | 0.009 % | 0.007 % |
| 1024 | 100 | 11314 | 1543 | 123.0 | 32x32 | 5.590 % | 5.589 % | 4.078 % |
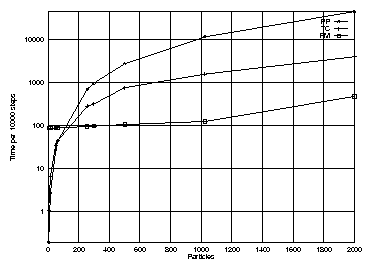
If we put all results from the tables 1 and 2 in a picture we could compare the efficiency for PP, PM and TC. We see in figure that indeed the computation time for PP increases much faster than for PM and TC. It is also nice to see that TC computation time increases smoothly with the number of particles, while PM stays constant for a while, but suddenly jumps if the meshsize has to be increased. The latter stems from the fact that the FFT routines only accept meshsizes that are a power of 2.
I also ran some larger uniform problems - both meshes and random sets - on only PM and TC, to see what their relative accuracy is and what the scaling of the computation time looks like. These larger problems - all generated by the 2 helper programs as mentioned earlier - are the same ones as already discussed in the Auto-Correlation section of chapter .
A special problem arose with the computation of the energy error : the potential energy computation is unfortunately an order O(N2) operation. This implies that for the large problems the bulk of the time would be spent in the energy error computation and not in the simulation part ! To give an idea : the total runtime for 131072 particles while doing the energy error computation was about 10 hours for PM and about 10.5 hours for TC, so this computation of the potential energy made the difference between PM and TC almost completely being washed out if only the total running time is being used.
For real large problems it may be an idea to use a Poisson equation and an FFT to compute an approximation of the potential energy, just as was done in the previous chapter (Analysis).
| Particles ( P ) | Steps ( S ) | Runtime | Energy leak | Mom. leak X | Mom. leak Y |
| Random sets and Tree-Code ( Q = 1 ) : |
| ||||
| 256 | 1000 | 28.32 | 5.1247 % | 3905 | -5891 |
| 1024 | 200 | 31.02 | 0.7801 % | 3373 | -2504 |
| 4096 | 100 | 102.50 | 0.0397 % | 96 | -61 |
| 16384 | 50 | 398.86 | 0.0067 % | 19 | 11 |
| 65536 | 10 | 629.77 | 0.0008 % | 31 | 34 |
| 131072 | 5 | 943.93 | 0.0002 % | 0.15 | 46 |
| Monotonous sets and Tree-Code ( Q = 1 ) : |
| ||||
| 256 | 1000 | 27.66 | 4.9800 % | -2750 | 3103 |
| 1024 | 200 | 30.52 | 0.7547 % | -4621 | 7284 |
| 4096 | 100 | 86.53 | 0.0739 % | -177 | 328 |
| 16384 | 50 | 381.33 | 0.0717 % | -663 | 1165 |
| 65536 | 10 | 681.62 | 0.0085 % | -1073 | 1928 |
| 131072 | 5 | 812.01 | 0.0002 % | -20 | 45 |
The output for Tree-Code and the generated sets can be found in table 3, while the same results for Particle-Mesh can be found in . For reasons explained before the runtimes given in these tables are the runtimes without the initialisation and energy error computation.
| Particles ( P ) | Steps ( S ) | Meshsize | Runtime | Energy leak | Mom. leak X | Mom. leak Y |
| Random sets and Particle-Mesh : |
| |||||
| 256 | 1000 | 32x32 | 9.43 | 3.6068 % | 36918 | 39992 |
| 1024 | 200 | 32x32 | 2.44 | 0.5712 % | 10176 | 28111 |
| 4096 | 100 | 64x64 | 5.69 | 0.0322 % | -66.23 | -168.8 |
| 16384 | 50 | 128x128 | 15.35 | 0.0048 % | -8.52 | -9.75 |
| 65536 | 10 | 256x256 | 16.88 | 0.0067 % | -15.97 | -8.83 |
| 131072 | 5 | 512x512 | 34.49 | 0.0002 % | 0.611 | -3.48 |
| Monotonous sets and Particle-Mesh : |
| |||||
| 256 | 1000 | 32x32 | 9.38 | 3.7670 % | -435.6 | -484.1 |
| 1024 | 200 | 32x32 | 2.45 | 0.5713 % | -310.3 | -251.0 |
| 4096 | 100 | 64x64 | 5.65 | 0.0559 % | -1.135 | -0.928 |
| 16384 | 50 | 128x128 | 15.07 | 0.0543 % | -4.257 | -3.532 |
| 65536 | 10 | 256x256 | 15.46 | 0.0070 % | -0.913 | -0.755 |
| 131072 | 5 | 512x512 | 30.12 | 0.0002 % | -1.620 | -1.692 |
To give an idea about the complexity of these problems, the number of computations for O(N2) and O(N·logN) operations for all the used combinations of particles and iteration steps is given in table .
| Particles ( P ) | Steps ( S ) | P2·S | P·logP·S |
| 256 | 1000 | 6.5·107 | 2.0·106 |
| 1024 | 200 | 2.1·108 | 2.0·106 |
| 4096 | 100 | 1.7·109 | 4.9·106 |
| 16384 | 50 | 1.3·1010 | 1.1·107 |
| 65536 | 10 | 4.3·1010 | 1.0·107 |
| 131072 | 5 | 8.6·1010 | 1.1·107 |
As should be clear when comparing the numbers from table 5 with the results from the tables 3 and 4, the runtimes increase a little faster than should be expected if we consider that both methods are supposed to scale with O(NlogN) . There are however several explanations for this phenomenon :
In the introduction I have listed some of the targets for this research project. I think I can say that most of the targets have been reached. However, although I did work already 2 years ago on the parallelization of the PP method described in this report, and although I have already done some work for the parallelization of the TC and PM programs as well, I didn't find the time to complete this unless I would be satisfied with only doing half work, resulting in i.e. a very poor speedup.
For this reason and also because this report is already quite a bit longer than I intended it to be at the beginning, I decided to omit the parallelization part completely and put the results in a separate report, to be submitted probably next year.
Ok, now it is the time to summarize some of the conclusions resulting from this report :